Wamkelekile, Welkom
UCT prof leads ground-breaking pollen monitoring campaign
20 November 2019 | Story Niémah Davids. Read time 7 min.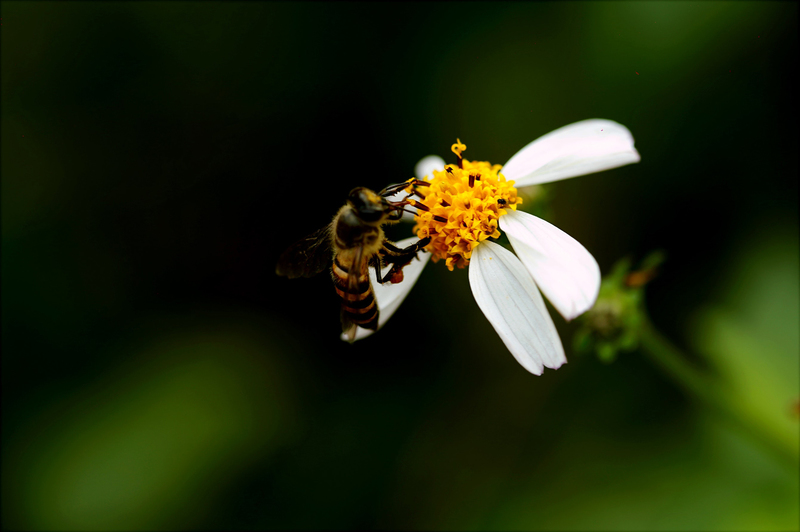
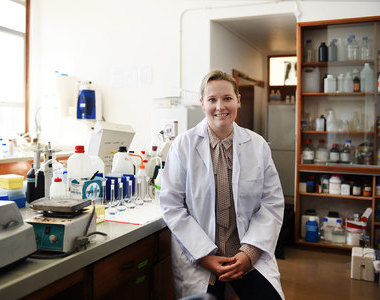
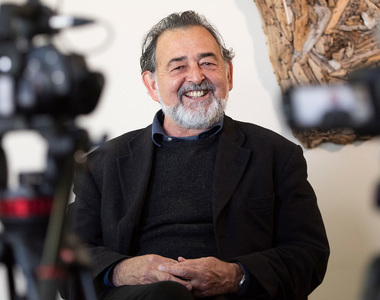
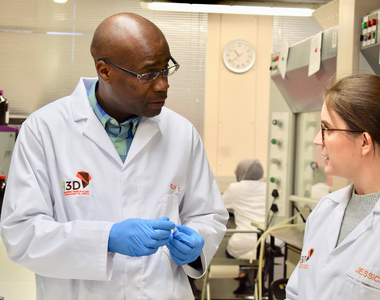
The Division of Allergology and Immunology at the University of Cape Town’s (UCT) Lung Institute is leading a multidisciplinary project examining the fluctuating pollen levels in South Africa, and the subsequent effects on the human body. The project may fundamentally change the allergy treatment process and the way healthcare professionals respond to common allergies like asthma, hay fever and eczema.
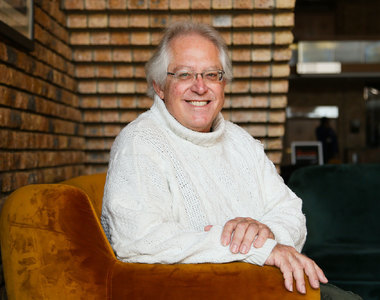
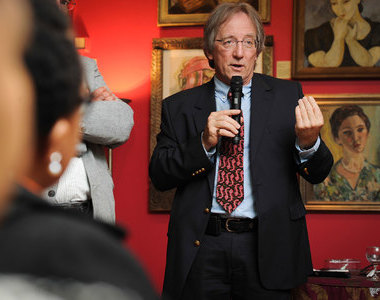
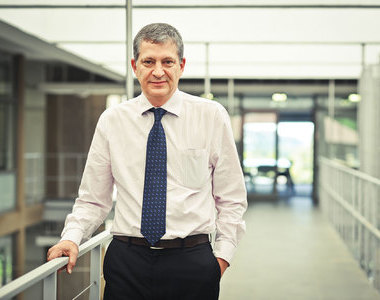
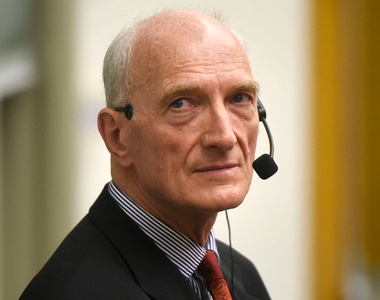
With pollen levels expected to increase exponentially in the country over the next two decades, the need for a formal nationwide monitoring process is necessary. This according to Associate Professor Jonny Peter, head of the Division of Allergology and Immunology.
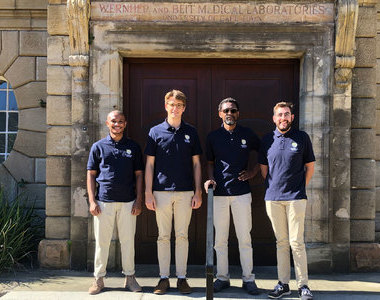
In partnership with academics at several leading universities in the country, including the University of the Witwatersrand, and the University of the Free State, Peter’s pollen-monitoring brainchild – The Real Pollen Count – continues to make significant strides when it comes to examining and responding to pollen levels.
The initiative seeks to raise awareness on the importance of pollen monitoring to better manage conditions like allergic rhinitis, asthma and eczema by obtaining accurate data on the main pollen triggers and when they occur.
“The reason for doing this is multiple. It’s for patients to know what’s in the air – that’s critical.”
The pollen-monitoring campaign has been in place in the Western Cape for 20 years. Peter said other provinces in the country have not been so lucky. Nationally, he said, pollen levels in Gauteng have not been monitored since the 1990s, while cities like Port Elizabeth and Kimberley have never had formal pollen monitoring campaigns in place at all.
Thanks to the campaign, there are now pollen-monitoring devices in seven South African cities: Johannesburg, Pretoria, Bloemfontein, Durban, Kimberley, Port Elizabeth and Cape Town.
“The reason for doing this is multiple. It’s for patients to know what’s in the air – that’s critical so that a diagnosis, related to these pollens can be made and they can get treated,” he said.
“From a nationwide public health perspective, increasing awareness on the impacts of climate change on air quality [is also important].”
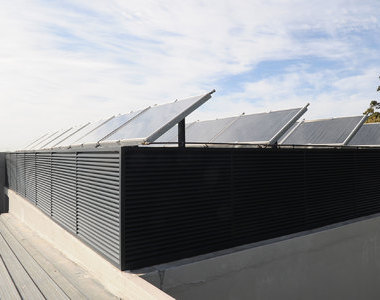
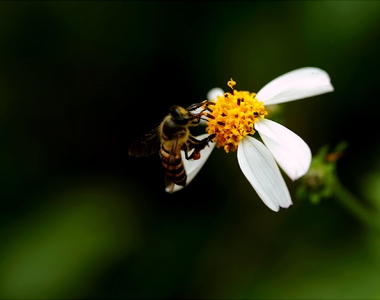
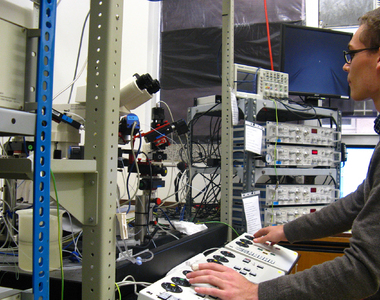
Trapping pollen
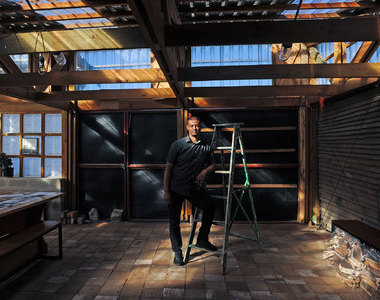
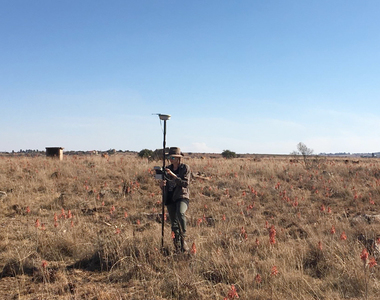
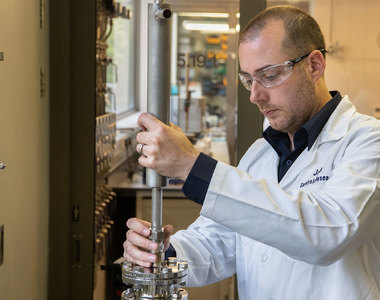
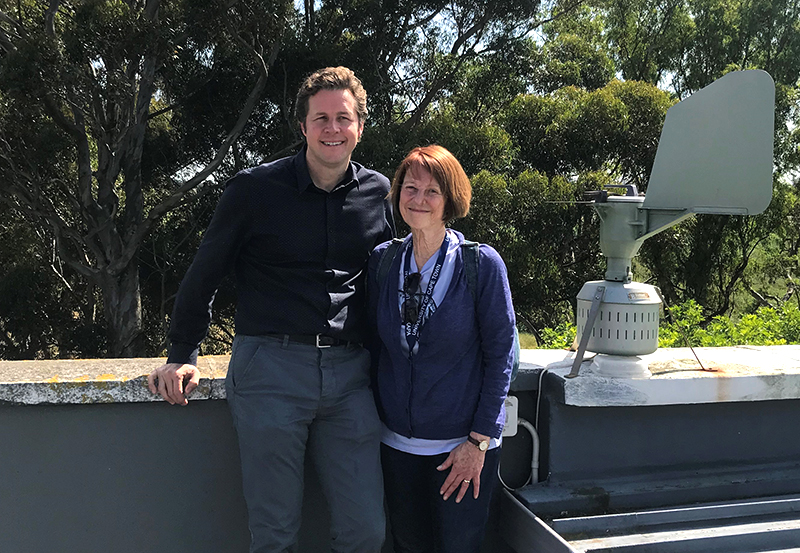
Peter explained that scientists monitor pollen levels on a weekly basis using a spore trap. The trap contains a drum with an air suction device and a wind vane to ensure the trap faces the right direction. Air is sucked into the drum, which contains a rotating clock that’s held together with sticky tape and covered with a Vaseline-type substance to trap the pollen.
“The drum rotates over the course of a week and the pollen is literally sucked in and sticks to the sticky tape,” Peter said.
But that’s the easy part.
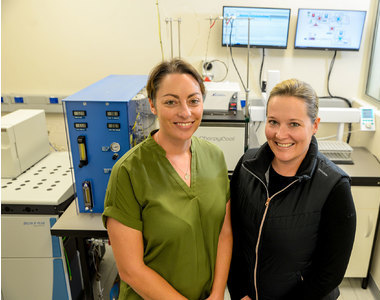
Thereafter, removing the strip and analysing its contents under a microscope to identify each individual pollen grain is what is most complex and requires the eyes of trained, expert aerobiologists.
Using a mathematical equation, scientists then calculate the amount of pollen in the air each day to provide the daily counts. This, he explained, needs to be done for each of the seven spore traps nationwide and requires a team at each university.
“Every week we’ll analyse and read what’s been in the air for the past week, and it’s usually predictive of the following week. We’re also working on ways in which to use weather data to better forecast day-to-day pollen.”
Traffic light system
To ensure the data is easily understandable for the layperson, scientists use the traffic light system to communicate weekly pollen results on the Real Pollen Count website.
Red indicates pollen levels are very high in a specific region and potentially dangerous to pollen allergy sufferers, especially asthmatics. Orange indicates that pollen levels are high, and allergy sufferers should keep outdoor activities to a minimum and use medication to minimise effects. Yellow and green indicate moderate to low levels of pollen.
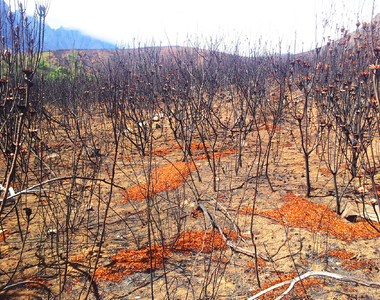
Increase in tree pollen
Based on the data collected since the start of the campaign, tree pollen reached the highest level in seven years in Cape Town this September.
“This has been a bumper year for tree pollen in Cape Town,” he said.
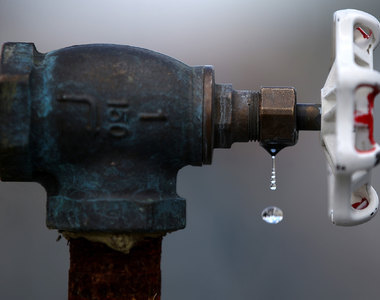
Peter added that this comes on the back of the Mother City’s devastating drought in 2018, where grass and tree pollen were peaking at their highest levels in 10 years.
“We’re concerned that this is a trend we’re seeing, which indicates that year-on-year, the levels are climbing. [Through this monitoring process] we want to try and obtain this kind of data to verify this across the country,” he said.
“This year, the temperatures rose quite quickly in the early weeks of September, and that probably led to the very high and rapid flowering of certain tree species.”
Next steps
Scientists suspect that climate change has a big role to play in the increase in pollen levels in Cape Town specifically. But the team needs to survey data over an extended period of time in order to verify this theory and draw accurate conclusions.
Step one is developing updated pollen calendars for the country. In some places pollen calendars have not been updated since the 1990s, and in other places pollen calendars are non-existent.
Step two is developing forecasting data to better understand the data holistically.
He said the team is also working with a group of experts from environmental geographical sciences to link air pollution to the heightened levels of pollen.
“In addition, we [also have] clinical initiatives in place to see whether we can update the way we test patients based on what we find in the traps,” Peter said.
“Hopefully, down the line our data will contribute to large scale networks for pollen monitoring and their link to climate change in South Africa.”
 This work is licensed under a Creative Commons Attribution-NoDerivatives 4.0 International License.
Please view the republishing articles page for more information.


Listen to the news
The stories in this selection include an audio recording for your listening convenience.