Wamkelekile, Welkom
Managing the Berg River Dam overflow
30 July 2019 | Story Kevin Winter. Read time 9 min.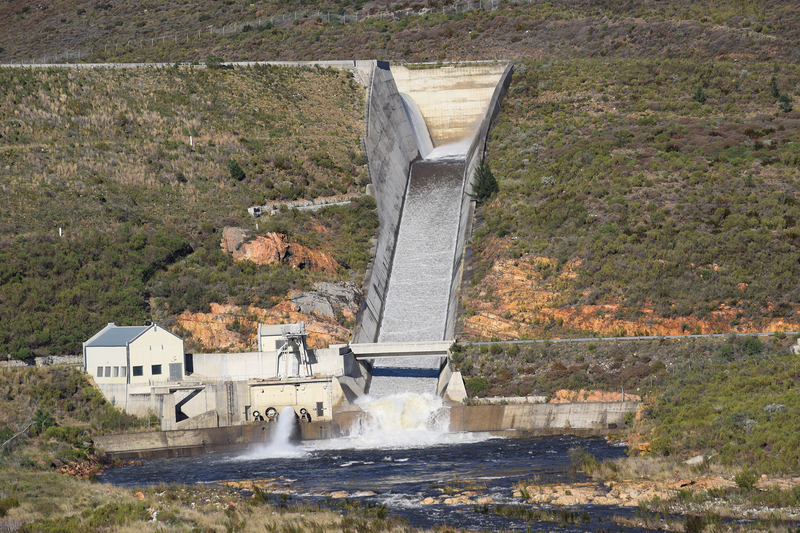
Last week (23 July 2019) the Berg River Dam reached full capacity for the first time in five years. Capetonians were relieved to see the first of its supply dams overflowing and releasing water into the Berg River. With more rain ahead, it looks likely that parts of the Berg–Olifants catchment will receive average winter rainfall for 2019 when compared to historical records.
Signs are encouraging that the major dams supplying Cape Town and the surrounding region will be 80% full by 1 November, which signals the start of the hydrological year, compared to 34% in 2017. However, the sight of overflowing dams raises a question often aired in the media, that “overflowing dams are a waste of water”.
Managing dams might be a lot harder than we think.
Dam managers clearly understand the storage part, but they have to deal with a complex set of requirements, such as groundwater recharge, abstraction of water (legal or otherwise), maintenance of aquatic life and discharges to release the build-up of pollutants, in addition to supplying sufficient water for downstream users. There is also a disjunction between the information required to manage a storage dam, particularly during extreme conditions of droughts and floods, and the condition of the receiving river.
Calls to build another large storage dam in the Western Cape ought to recognise the limitations and immaturity in monitoring and understanding of complex natural systems.
A new generation dam
The R1.5 billion Berg River Dam was commissioned by the South African Cabinet in 2002 and completed in 2008. The project was approved on condition that the City of Cape Town reduce its water demand by 20% by 2020. This was the first time that a bulk water resource project in South Africa was directly linked to a water demand management strategy.
“This was the first time that a bulk water resource project in South Africa was directly linked to a water demand management strategy.”
The record of decision that followed the environmental impact assessment stated that the dam must ensure sufficient flow to service the ecological reserve. This concept means that the dam had to be managed so that sufficient water is released to maintain important aquatic life, biodiversity and habitat integrity; support ecological goods and services; and ensure sufficient water for downstream users. All of this is a big ask for reservoir managers whose brief is to operate a storage system, particularly while they have limited feedback about the condition of ecological systems and water requirements in the Berg River, which stretches for over 300 km from the dam.
At the very least, the operating conditions for the Berg River Dam were progressive in the sense that it was required to release low flows and high flows that coincided with natural inflows and natural flood events. That might seem obvious, but what happens in a drought?
The drought years
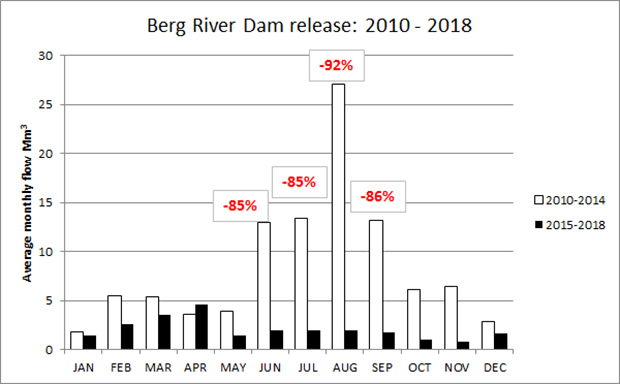
During the Western Cape drought, water was deliberately stockpiled in the Berg River Dam. It made sense to pump water from the Theewaterskloof Dam, a shallow dam with a large surface area exposed to evaporation, to the Berg River Dam, a deeper dam with a smaller surface area. Storing water in the Berg River Dam during 2017 and 2018 also meant that water could be released to meet the needs of the ecological reserve. According to data from the national Department of Water and Sanitation, the release of water from the Berg River Dam during 2017 and 2018 was often less than 1 million cubic metres per month, on average.
The percentage difference between wet periods (2010–2014) and drought (2015–2018) is shown in the graph below. It compares the reduction in discharge during wetter and drier years and the percentage differences during the winter rainfall months. Inflow data for the dam is not available for further comparison, but the graphic shows a dramatic reduction in the release of water from the dam. Managers of the dam can justify the position that they took, but what effect did this have on the ecological reserve, and what indicators are available to tell the story?
Eutrophication of the Berg River
Data on the ecological health of the Berg River is absent – perhaps still being processed by researchers. Instead, a proxy indicator will be used to illustrate the condition of the Berg River downstream from the dam. Studies of the Berg River upstream from the dam show that the stretch between Paarl and Wellington are permanently hypertrophic (very high in nutrients), resulting from failed or poorly functioning municipal sewerage systems and contaminated storm water, but mostly from runoff from informal settlements.
Eutrophication in water bodies reduces dissolved oxygen concentrations; increases the frequency of algal blooms; causes rapid growth of bacteria; creates anoxic zones that are stressful or even lethal for invertebrates and fish; and leads to losses in biodiversity from excess nutrients and minerals. In theory, the level of eutrophication increases with decreasing stream flow and could therefore be used as an indicator of how well the ecological reserve was serviced during the drought.
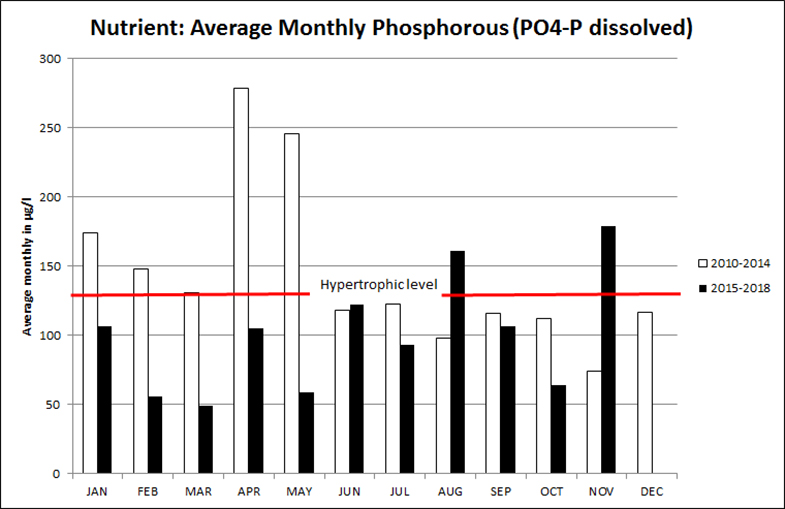
Releasing more water from the Berg River Dam helps to flush out the build up of nutrients in the Berg River, but is by no means an effective way of managing a deteriorating river system. Water-quality data taken near the small town of Hermon – the only sampling site downstream of Paarl and Wellington with some consistent data for the period 2010–2018 – shows how phosphorous, as an indicator of nutrient levels, varied during the wetter and drier period. When phosphorous levels are greater than 130 micrograms per litre, the National Eutrophication Monitoring Programme classifies the water body as hypertrophic.
Following the logic of the role of water release in servicing the ecological reserve, the data shows that when more water was released from the Berg River Dam during winter rainfall (2010–2014), there are signs that trophic levels were reduced. By contrast, low-flow conditions during the dry period (2015–2018) caused trophic levels to rise above the hypertrophic threshold, notably in the months of August and November.
But the data doesn’t give a conclusive analysis. The number of times that sampling occurred at the Hermon site (2015–2018) shows a 40% reduction by comparison, with no sampling taking place during the month of December for the entire period. The only conclusion that can be drawn from this is that data and information informing catchment and dam managers is so limited that it would be impossible to balance the needs of water supply against the needs of the ecological reserves of the river.
Can we do better?
The immediate challenge is to deal with the paucity of data that is currently too weak to inform water managers of the Berg River of the effects of the discharge from the dam. In addition, the release of water from the Berg River Dam will not solve the ongoing impact of poor land management and the excessive discharge of pollutants into the river.
It seems that there is a long way to go before new dams are considered for storing excess water without understanding the effect on riverine ecological goods and services. The blame cannot reside entirely with the management of the Berg River Dam, considering the limited feedback that they receive. What is urgently needed is a comprehensive monitoring plan that includes indicators about the state of the ecological reserve and offers timely information to managers involved in a range of functions for maintaining and regenerating the river.
 This work is licensed under a Creative Commons Attribution-NoDerivatives 4.0 International License.
Please view the republishing articles page for more information.