Wamkelekile, Welkom
COVID-19 dashboard measures resurgence risk
30 December 2020 | Story Niémah Davids. Read time 5 min.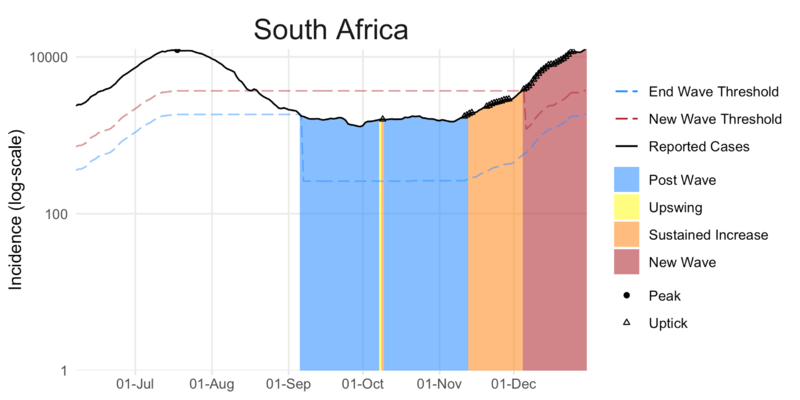
As the second wave of the COVID-19 pandemic grips South Africa, a multidisciplinary team of researchers from some of the country’s leading universities and civil society have put their heads together to develop a COVID-19 dashboard. The platform analyses the resurgence risk, monitors hospital admissions and presents other essential data relating to the pandemic.
The SACMC Epidemic Explorer is the brainchild of the South African COVID-19 Modelling Consortium (SACMC); it surveys the COVID-19 epidemic and highlights its spread throughout the country. The SACMC comprises a group of researchers from the University of Cape Town (UCT), Stellenbosch University and the University of the Witwatersrand, as well as local non-profit organisations (NPO) and government institutions. It is facilitated by the National Institute for Communicable Diseases (NICD) and acts on behalf of the Department of Health.
UCT News spoke to Dr Sheetal Silal, director of UCT’s Modelling and Simulation Hub Africa (MASHA), the developers and hosts of the SACMC Epidemic Explorer, who highlighted the need-to-knows on the platform.
Niémah Davids (ND): Tell us about the Epidemic Explorer and the data it covers?
“The publicly available dashboard explores the COVID-19 epidemic in South Africa using data from the NICD.”
Sheetal Silal (SS): The publicly available dashboard explores the COVID-19 epidemic in South Africa using data from the NICD. The platform presents metrics of case risks and hospital admissions and helps to better define and understand the occurrence of the second wave for all provinces and districts in the country.
ND: What’s the dashboard’s main goal?
SS: The Epidemic Explorer aims to help the public to understand COVID-19 risks by illustrating trends in cases for all districts in the country. The open-access dashboard presents a subset of the metrics used to support government’s COVID-19 planning efforts.
The platform analyses the resurgence risk by surveying the number of cases relative to the population, the growth rate of these cases and also looks at whether cases are increasing on a daily basis.
ND: How does the dashboard inform South Africans about COVID-19 resurgence risks both provincially and nationally?
SS: For every district and province in the country, the dashboard presents two different metrics. The first is a metric to measure the COVID-19 risk categorised into three groups – low medium and high – based on positive cases. The metric indicates the size of the epidemic, and because it is measured per 100 000 of the population, it can also be used to compare the size of the epidemic between different districts.
In addition, the dashboard also presents an analysis of the epidemic curve to establish when the second wave kicked-off. This can also be used to assess if the daily case counts are increasing rapidly or slowing down. The dashboard depicts the new daily COVID-19 hospital admissions and current bed occupancy for both public and private hospitals per province, which also allows the public to gauge just how quickly hospitals are filling up.
ND: How are South Africans encouraged to interact with the platform?
SS: The dashboard can easily be accessed online without having to create an account or signing in. While the Epidemic Explorer can be accessed on a mobile phone, the data is best viewed on a computer or tablet. The data is presented in a way that is easy to understand and is not just applicable to the area an individual lives in, but also other areas and provinces around the country.
ND: Talk to us about MASHA’s role in this process
“MASHA is performing some of the data analysis and is also building, hosting and maintaining the dashboard.”
SS: MASHA is performing some of the data analysis and is also building, hosting and maintaining the dashboard. The team updates the platform every second day, so the data remains current and relevant.
As with all the disease modelling and analytical work from the SACMC, MASHA is delighted to continue working with the South African Centre for Epidemiological Modelling and Analysis (SACEMA) at Stellenbosch University, the Health Economics and Epidemiology Research Office (HE2RO) at the University of the Witwatersrand and the NICD.
 This work is licensed under a Creative Commons Attribution-NoDerivatives 4.0 International License.
Please view the republishing articles page for more information.