Wamkelekile, Welkom
Overview of benchmark results
04 November 2022
The graph below highlights the extent to which UCT has met the transformation benchmarks over the 2019–2021 period. The graph captures this through representing the percentage of benchmarks met. The graph is representative of the entities which responded in each year.
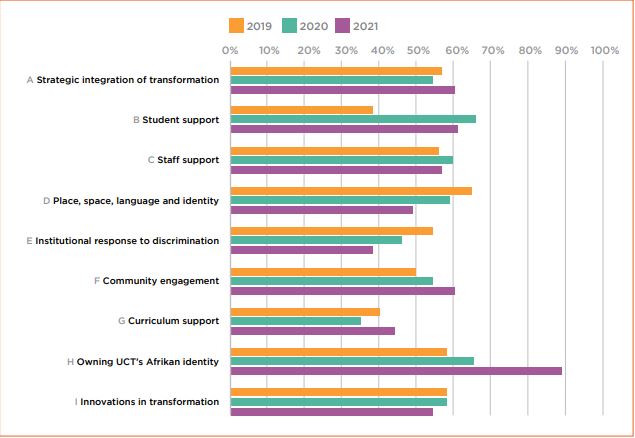
Above: The graph shows the extent to which UCT met the transformation benchmarks in 2019, 2020 and 2021. For example, in 2021 UCT on average met three out of the six criteria for the “strategic integration of transformation” benchmark, and three out of four of the criteria for the “student access and support” benchmark. The graph illustrates where UCT’s areas of strength and weakness are, and the narrative provided shares some explanation of these.
While there is data available for 2019, 2020 and 2021, it is important to only use these as an indication of progress, regression or stagnation. This is because the scores on their own don’t indicate the quality of the actions undertaken (this is better captured through the qualitative descriptions), the environmental factors at play (such as COVID-19) or other changes in the environment (for example, leadership changes in the transformation portfolio). Even with these limitations, the benchmark scores offer an indication of the challenges and changes related to TDI work.
- Possible progress: Actions under benchmarks B, F and H have grown over the three years, which could indicate support for change in this area. These could be understood as emerging areas of strength.
- Peaks and dips: Actions under benchmarks A, C, G and I have gone up and down, and it’s unclear in which direction these benchmarks will move. These could be understood as areas of divergence with different entities moving in different positive or negative directions.
- Indication of a problem: Actions under benchmarks D and E have declined each year, which could indicate a problem or challenge. These could be understood as areas where insufficient support or priority is accorded.
What do the benchmarks reveal?
Thirteen entities (at the level of faculty and non-academic department) completed their benchmark reports in 2021:
| Centre for Higher Education Development | CHED |
| Faculty of Commerce | COMM |
| Department of Student Affairs | DSA |
| Faculty of Health Sciences | FHS |
| Graduate School of Business | GSB |
| Human Resources Department | HR |
| Faculty of Humanities | HUM |
| International Academic Programmes Office | IAPO |
| Faculty of Law | LAW |
| UCT Libraries | LIBR |
| Properties and Services | P&S |
| Research Office | RO |
| Faculty of Science | SCI |
Several others submitted partially completed reports. All 13 completed reports were used for the visual representations of the benchmarks in each section. Reflections, anecdotes and stories from each department and faculty are shared in the “What does the benchmark reveal?” section. This section also includes good practice stories relevant to each benchmark.
Overall, every faculty and several departments reported actions which enabled staff and student access, support and success. These included ensuring students had access to psychosocial and education support, and focusing on diversifying both student and staff demographics. Faculties and departments also reported actions which supported staff development and growth, and which focused on UCT’s African identity (and responded to racism). Some benchmark areas reported fewer actions in 2021, including the focus on place, space, language and identity.
 This work is licensed under a Creative Commons Attribution-NoDerivatives 4.0 International License.
Please view the republishing articles page for more information.


