Wamkelekile, Welkom
Mapping pixels with UCT eResearch
29 December 2017 | Story Lisa Boonzaier. Photos Supplied.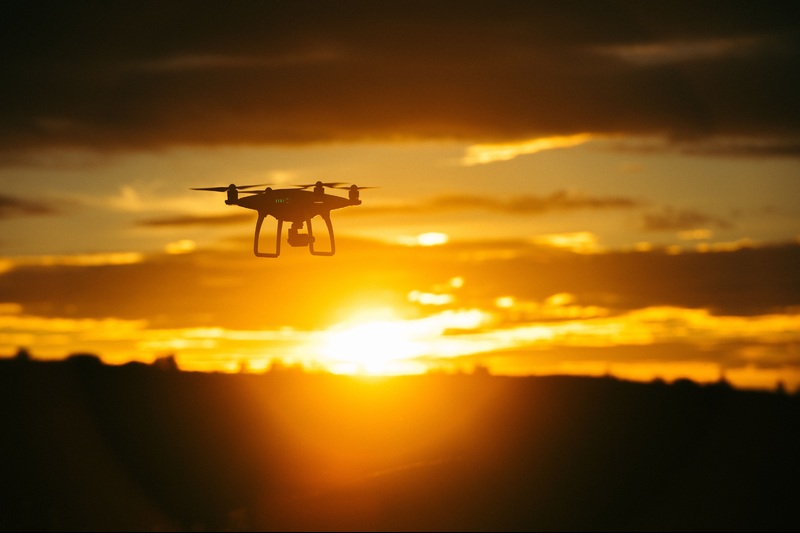
When Associate Professor Adam West from the Department of Biological Sciences began using drones to collect data from his fynbos study plots, he was confronted by a big-data problem. The customised drones were efficient and collected data easily, but they collected a lot of it – more than could be processed timeously by his laboratory’s computers.
He reached out to the team at UCT eResearch for support. “Our big-data problem wasn’t on the scale of a Square Kilometre Array big-data problem. But for physiologists who are used to small amounts of data, it was a computing challenge.”
From leaf to globe
West calls himself an eco-physiologist. He’s interested in ecosystems and the physiological processes that underpin them. In plants, these physiological processes include things such as photosynthesis, and the absorption and transpiration of water. These processes happen at the level of an individual plant – or leaf – but when they are scaled up to landscapes, they have an effect on the way natural systems work.
West wants to make the connection between plant-level processes and regional- and global-scale observations, specifically satellite imagery.
“But the remote sensing products we as natural scientists can get access to are relatively coarse in terms of their resolution; 30-by-30 metres is the highest resolution that we have,” explains West. “But if you’re working in fynbos, or any kind of biological system, a 30-by-30-metre pixel doesn’t really help you to scale down to the level of biodiversity.”
West’s tool of choice for bridging the gap between individual plants and 30-by-30-metre plots: customised drones. The imagery and information that the drones gather by camera can be used to identify species of plants on a plot and their size, and to produce an index of the vegetation’s health.
Ten years ago it was a much more manual process. “We’d swing cameras up over the plot, we’d run cables up to them, take the photo, swing them down, pull out the memory cards, stick them in a laptop. ‘Did we get the image?’ ‘No, we didn’t.’ And swing them up again. It would take us weeks to get the imagery. It was a bit of a nightmare,” says West.
The drones, programmed to fly in a grid pattern over the study area, have banished that nightmare, but they present a data challenge. One survey of a single plot can generate more than 2 000 images, each of which is a multi-megapixel file.
That’s a lot of pixels
“Very early on we identified a software package, Pix4D, that would help with the processing. Then, when we started getting our first big datasets, we realised that to process a single batch would take 24 to 48 hours, depending on the number of images,” says West. “That’s when we got eResearch involved.”
West collaborated with Timothy Carr, a senior technical specialist at UCT eResearch. Carr was able to contact the developers of the Pix4D software and install a version on UCT’s high-performance computers.
“Adam West’s requirements presented a unique case,” says Carr. “First, he required lots of compute power, so his traditional desktop took quite a long time to stitch all of the drone images together. In addition, West’s desktop software version of Pix4D wasn’t engineered to run on our high-performance computing centre.
“But we were able to configure the Pix4D software to make use of the extensive amount of processing power that we have available in our cluster.”
eResearch services
After processing the thousands of images from West’s drones, the high-performance computing cluster would furnish him with a 3D map of his study site to manipulate on his own computer. The map is navigable – you can pan around it and zoom into areas of interest – and shows individual plants and their structures. Viewed from the side, you can measure the height of a plant canopy. Combine that with the area from above and you can calculate the volume – or biomass – of a shrub.
For the time being, someone has to do these calculations manually, but West has plans to extend his analysis into machine learning. This is another area where he foresees a need for eResearch’s support, because machine learning is also a processing-intensive method.
When one thinks of big data, ecology might not be the first field that comes to mind. But big data is permeating all areas of research enquiry. And regardless of whether the big-data challenge is massive or small, there are opportunities across UCT harness the support and services of eResearch.
 This work is licensed under a Creative Commons Attribution-NoDerivatives 4.0 International License.
Please view the republishing articles page for more information.