Wamkelekile, Welkom
The state of SA’s youth
16 June 2017 | Story Yusuf Omar.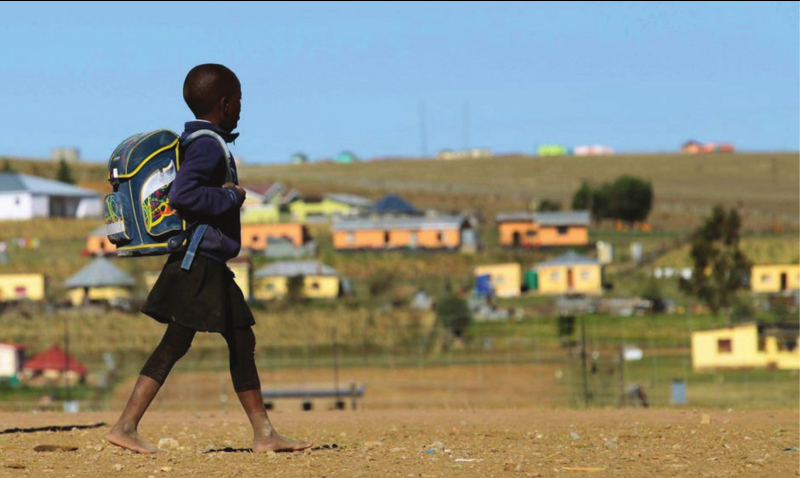
Only 32.7% of Manenberg’s 6 685 young adults (between 15 and 24) have completed matric, and equivalent or higher. And only 15% of people in that age group are currently attending an educational institution. In this same age group, 64.6% of students who wrote matric in 2015 passed, but this was only 28% of the Grade 8 students who entered high school in 2011.
All this, and much more demographic data for young adults in South Africa, is available on the new Youth Explorer online portal, which launches on Youth Day (16 June) 2017.
The portal sheds light on the state of our young people’s wellbeing as far as their access to healthcare, education, employment, the types of dwellings they live in and who they live with, relative poverty (or wealth), vulnerability to crime, plus a range of other detailed indicators.
The data pops up on easy-to-read charts, infographics, maps and other interactive features.
The Youth Explorer is an innovative tool that is useful to anyone working in youth development – from national and provincial governments to civil society organisations implementing policies and programmes in communities – as well as community members and youth themselves, say UCT’s Poverty and Inequality Initiative (PII), who developed the tool.
“Youth development is currently high on the national agenda,” says Professor Murray Leibbrandt, Pro-Vice-Chancellor for Poverty and Inequality at the University of Cape Town, and director of the Southern Africa Labour and Development Research Unit.
Government adopted a number of youth-focused policies and projects recently. There was the new National Youth Policy in 2015, and a recent Presidential Youth Working Group meeting has assessed efforts that support young people and proposed further actions. Later this month, the Department of Cooperative Governance and Traditional Affairs will launch the Local Government Youth Development Forum to examine the role of local government in youth development.
“For these and other youth development processes to be effective, a thorough understanding of the situation of the youth population at the community level is essential for the effective design, planning and roll-out of youth services”, explains Emily Harris of the PII, a key driver of the Youth Explorer project. “Those responsible for implementing policies in local municipalities or communities need clear facts and numbers on the specific needs of young people in the areas where they live. However, such fine-grained information is often hard to come by.”
Harris and her colleagues at the PII hope that Youth Explorer can go some way to solving this information gap by providing useful information on young people at many geographic levels, including electoral wards and district municipalities.
Why geography-based data?
In a country marked by extreme inequalities, the realities of young people vary widely from one geographic space to another.
While both national and provincial policies stress the need to understand youth as a heterogeneous group, Dr Ariane De Lannoy, explains that such policies rarely engage with the complexity and combination of challenges faced by young people in their particular communities.
“The lived realities of youth living in Soweto, for instance, are not the same as they are in Inanda or Khayelitsha,” says De Lannoy, who is senior researcher at the PII and principal investigator on the Youth Explorer project.
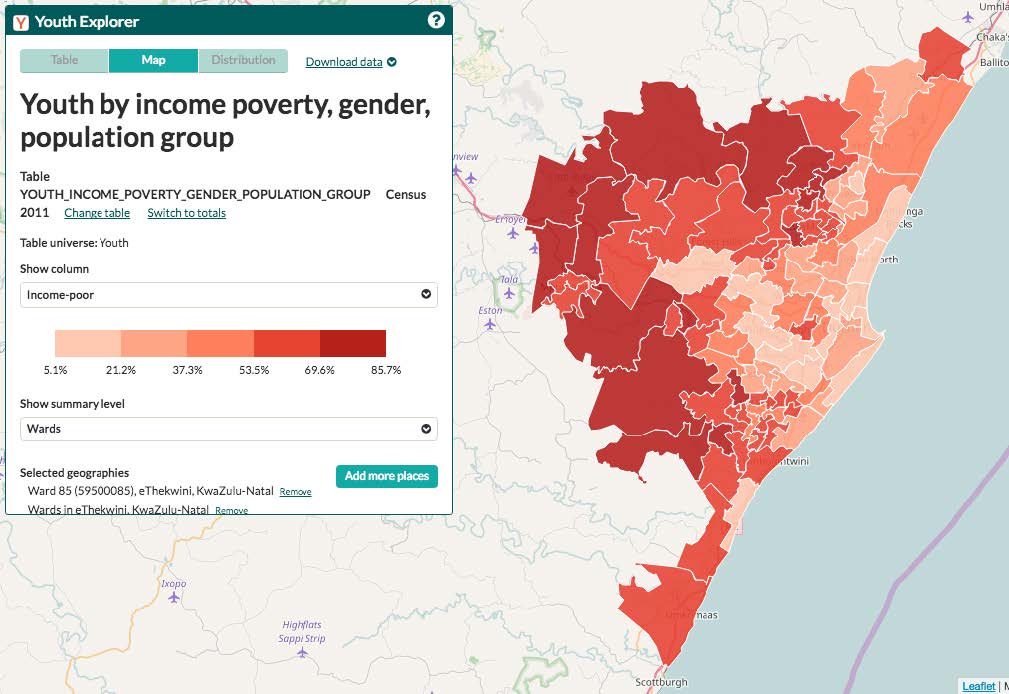
Youth Explorer can easily produce maps that show a spatial perspective of youth outcomes in the area, look for outliers and interesting patterns in the figures, or compare any two areas to see how different socio-economic conditions affect the youth population.
Stats about language distribution might hint at migration, for instance, and by comparing neighbouring wards, detailed information about young people’s socio-economic wellbeing can be gleaned, pretty much at the click of a mouse.
Such insights into how young people’s situations differ across communities can assist in fine-tuning national programmes to align with the actual lived realities of youth in their specific contexts, say the PII.
Now that the portal has been launched, Youth Explorer is making the data more accessible for people working in youth development, says Harris.
The portal builds on a pilot stage that was developed in collaboration with the Western Cape Government and the City of Cape Town, with additional support from the Cape Higher Education Consortium and the Department of Science and Technology’s National Research Foundation Centre for Excellence in Human Development at the University of the Witwatersrand.
Youth Explorer uses the same technology applied for Wazimap.co.za, which is based on the Census Reporter, and is entirely open source. It was developed in partnership with OpenUp (formerly Code for South Africa), Statistics South Africa and the Economies of Regions Learning Network.
 This work is licensed under a Creative Commons Attribution-NoDerivatives 4.0 International License.
Please view the republishing articles page for more information.