Wamkelekile, Welkom
Rapid assay analysis? There’s an app for that
25 July 2017 | Story Kate-Lyn Moore.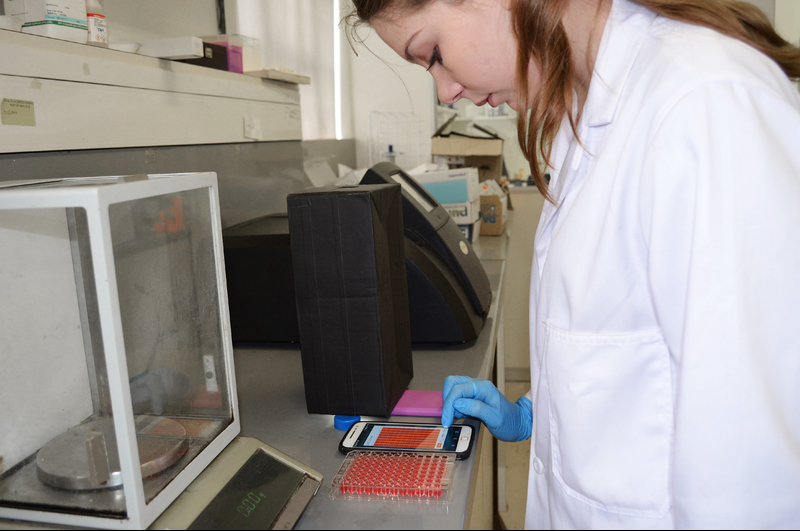
We carry a lot of computing power in our pockets, and it can be used to power a great deal more than Instagram.
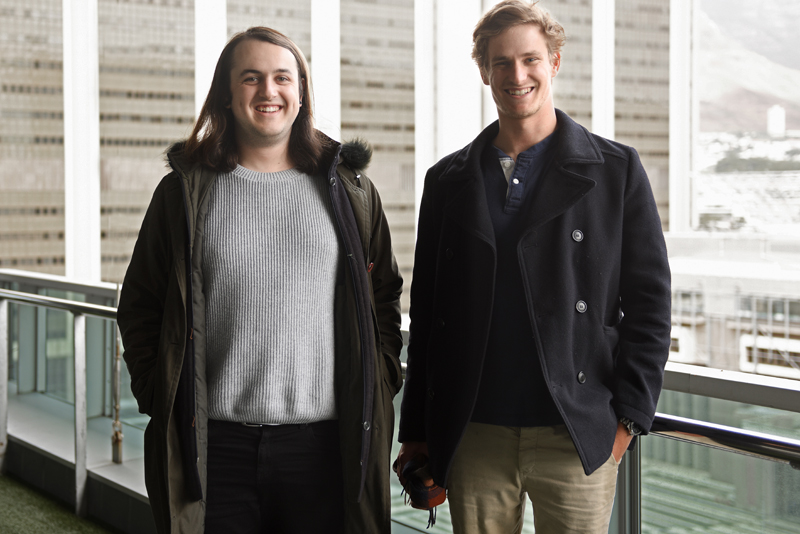
Aiming to demonstrate just how much can be achieved using smartphone technologies, James Foster and Shaun Maxwell of the UCT Department of Computer Science developed a mobile app that can be used to streamline and support research and drug testing, particularly in less well-equipped laboratories.
The project, which was supervised by Associate Professor Michelle Kuttel, resides in the minute intersection between computer science, chemistry and physics.
The app, called MicroMob, mimics the function of a microplate reader, an essential but expensive piece of lab equipment that is part and parcel of laboratory research and drug testing.
The app rapidly analyses the 96-well microplate trays prepared for testing and delivers an IC50 value, which is a measure of how effective a drug is. It tells researchers how much of the substance is needed in order to inhibit a biological process (like when you contract an illness) by half. The aim, essentially, is finding the lowest concentration of a drug needed to produce the most effective result.
Testing takes a significant amount of time. Researchers generally test two or three compounds in triplicate, explains Maxwell. So they would have several plates that need to be imaged individually, with each process taking roughly an hour. If a lab does not have a microplate reader of its own, it will have to send its trays to better-equipped labs. Researchers then have to painstakingly record this data before importing it into various other programs to obtain their results.
This takes up valuable research time. Foster and Maxwell hoped to distil this process and create an app that would work quickly while remaining accurate.
The resultant app can be used to rapidly assess whether or not a particular compound will be viable.
Low-tech and affordable
After preparing the microplate, the researcher needs merely to open the app, take a photograph of the plate, then use the program to select the different drugs present in the wells.
The imaging is done inside a makeshift black box to reduce glare. The microplate is placed inside and illuminated from beneath, using the flash of a smartphone camera to ensure that the image is as clear as possible.
Click ‘analyse’ and the app will do its work – the data will be interpreted as two graphs and can be easily exported to cloud storage.
Once on the right track, users can send on their combinations to be assessed on a microplate reader.
The app is not a complete replacement for a microplate reader, notes Foster, but would be useful in isolated field work, or in remote laboratories.
Colour-coding your results
The pair was well equipped to take on the technological elements of the project. It was getting to grips with the chemistry that proved the most challenging.
“I sat with the chemistry students for hours, learning what they do, and thinking how we can replicate it in an app,” says Foster.
Microplate readers use light to complete their analysis, measuring how much of this light is absorbed between one end of the well and another. A phone cannot do that. So the app developers were forced to find a different approach.
The project had been tackled by a previous group of computer science honours students, who laid a great deal of the groundwork. They built a prototype that used colourmetrics to analyse the assays.
Colour is intricately linked to the viability of plates tested, explains Maxwell. When a drug has inhibited a reaction, the solution will change colour.
The researcher adds increasing concentrations of the drug being tested across the assay plate. After being incubated, a viable plate will have produced a particular spread of colour. It will have wells that are exceptionally light on the one end and dark on the other. Between these points there should be a sudden change in colour. This is the IC50, the point where the drug is effective at the lowest concentration possible.
It is this change in colour that the MicroMob application measures.
“Phones cameras these days have great pixel density so we can actually extract each colour,” says Foster.
It was up to Maxwell to ensure that this was done as accurately as possible. He spent a great deal of time researching image processing techniques and the various colour spaces available in computer science.
“Because you don't have this absorbance to work with, you’ve got to find a way to quantify a colour so that you can compare one to the other,” says Maxwell.
A smartphone’s default colour space, RGB, was less than useless. It cannot intuit the differences between shades of red.
In the end he selected the mathematically defined CIE1931 colour space.
“The idea with this colour space is that if you plot two colours on an x and y plane, the distance between them is meaningful in terms of a change in saturation. Saturation was key.”
He also honed the accuracy of the app’s well detection, to ensure it knew the exact coordinates of each point in the plate.
User-centred design
Accurate data collection is all well and good, but if an app does not take its users into account, then this will remain purely academic.
Foster focused on the usability of the app by looking at human-computer interaction, usability studies and user-centred design approaches.
He began building paper prototypes and testing them on users. When there was a fully developed app, this was tested too.
“I used a bunch of different pharmacology and chemistry students to test the application. My approach was very user centred and iterative. So we built upon designs, took their feedback and made an application that actually was considered usable by those representative users,” he said.
 This work is licensed under a Creative Commons Attribution-NoDerivatives 4.0 International License.
Please view the republishing articles page for more information.


Research & innovation